Documentation Index
Fetch the complete documentation index at: https://docs.zencoder.ai/llms.txt
Use this file to discover all available pages before exploring further.
Overview
The Analytics dashboard shows daily usage data for your organization: active user counts, per-member activity, IDEs and languages used.Analytics is available for users on Core plans and above. Access requires Owner or Manager role permissions within your organization.
Accessing Analytics
Navigate to your Analytics dashboard directly, or go to auth.zencoder.ai and selectAnalytics from the sidebar navigation.
Dashboard Components
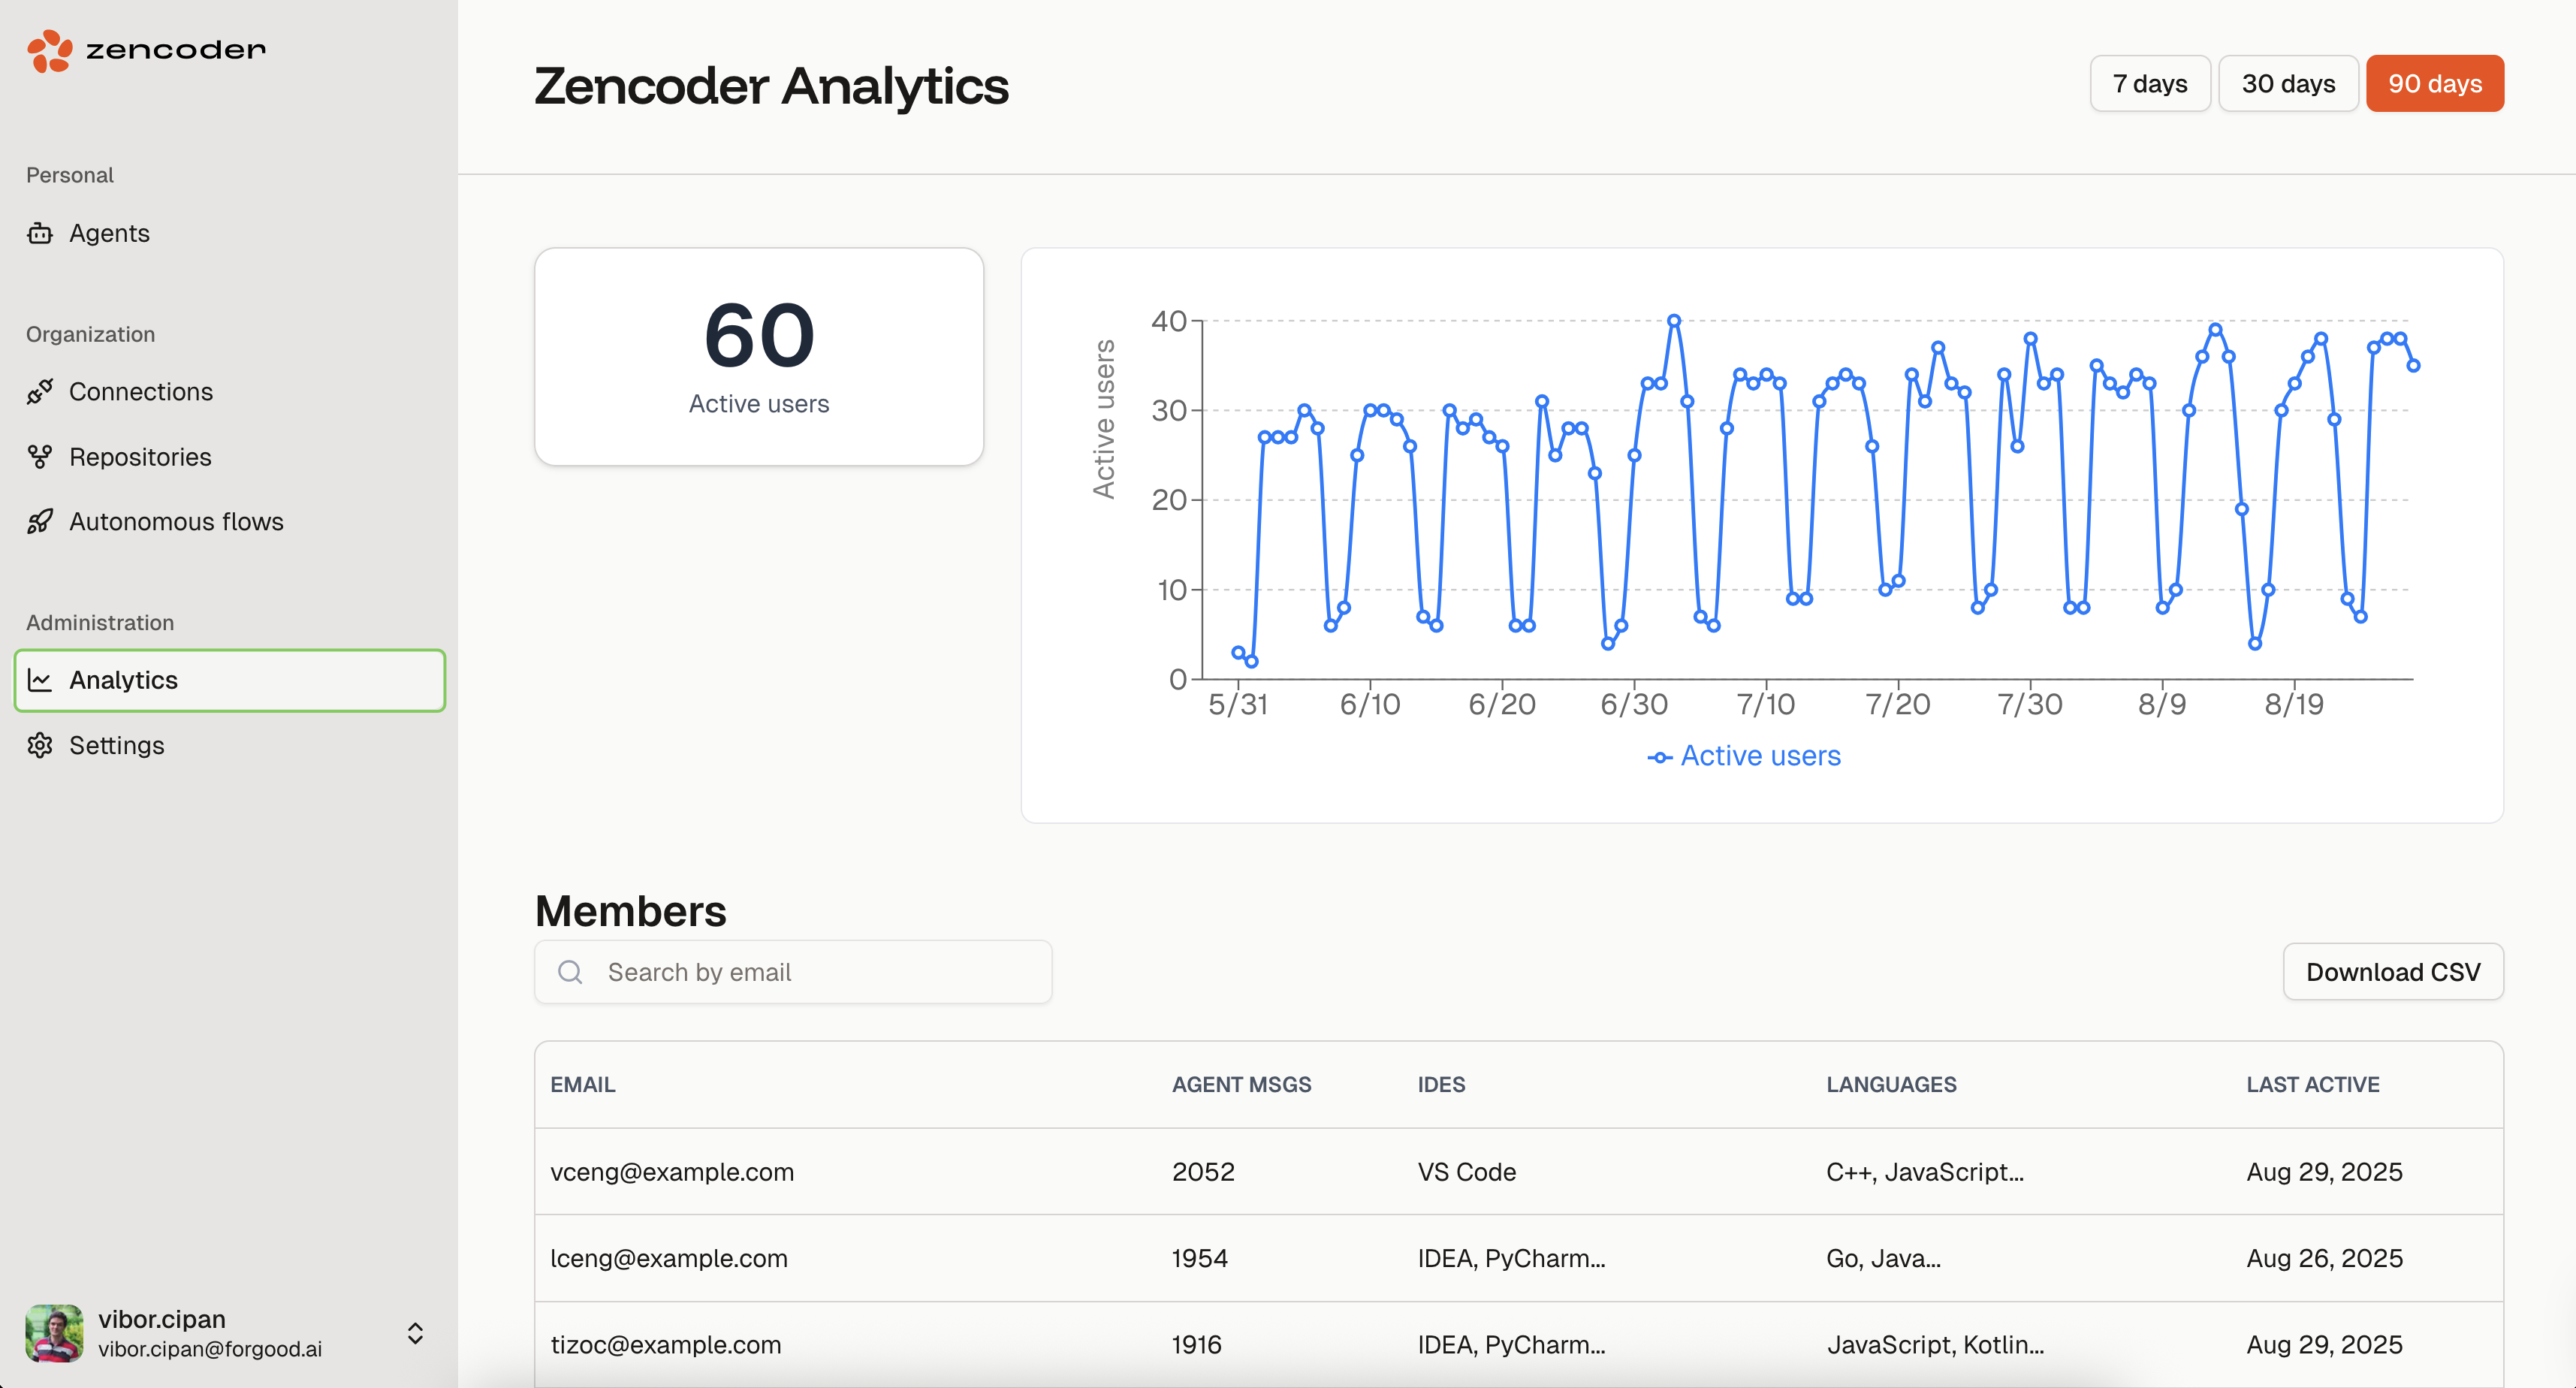
Active Users Metric
Shows the total number of unique users who used Zencoder agents during the selected time period.Usage Trends Graph
Line chart of daily active users over time. Hover over a data point for exact counts.Time Period Filters
7 days— recent activity30 days— monthly patterns90 days— quarterly trends
Member Activity Table
Per-user breakdown:| Column | Description |
|---|---|
Email | User email address |
Agent Messages | Total agent interactions |
IDEs | Development environments used by each member (VS Code, IDEA, PyCharm, etc.) |
Languages | Programming languages used with Zencoder |
Last Active | Most recent activity timestamp |
Data Export
Download your analytics data as a CSV file for:- Integration with existing business intelligence tools
- Custom analysis and reporting (including IDE and language distribution)
- Compliance and audit requirements
- Historical record keeping
Best Practices
- Set baselines — establish normal usage patterns so anomalies are visible
- Review regularly — weekly or monthly check-ins on usage data
- Track onboarding — monitor new user activity after rollouts
- Reallocate seats — move unused seats to active teams based on actual usage
- Export for reporting — CSV export feeds into BI tools or compliance audits
Troubleshooting
Analytics not visible in the sidebar / No data displayed
- Verify you have Owner or Manager permissions
- Ensure your subscription is Core or higher
Missing Users
- Confirm users are part of your organization
- Verify users have authenticated at least once
- Check if filters are excluding certain time periods
Export Issues
- Ensure your browser allows file downloads
- Check available disk space for CSV downloads
- Try a different browser if issues persist