> ## Documentation Index
> Fetch the complete documentation index at: https://docs.zencoder.ai/llms.txt
> Use this file to discover all available pages before exploring further.
# Troubleshooting
> Debug information, logs, known issues, and common fixes for the Zencoder IDE plugin (VS Code and JetBrains).
## Get Help
Real-time help from the community and Zencoder team.
Discuss with developers in the Zencoder subreddit.
For account or sensitive issues — **[support@zencoder.ai](mailto:support@zencoder.ai)**
Before reporting a new issue, please gather the debug information described below — it dramatically speeds up resolution.
***
## Debug Information
Each request to Zencoder is assigned a unique **Operation ID**. Sharing this identifier helps us trace exactly what happened in our systems.
### Enabling Debug Info
1. Go to `Settings` (`File > Preferences > Settings` or press `Ctrl+,` / `Cmd+,`).
2. Search for `Zencoder: Display debug info`.
3. Check the box labeled `Controls whether debug information is displayed in the interface`.
 Once enabled, Operation IDs appear in the Zencoder interface for each request:
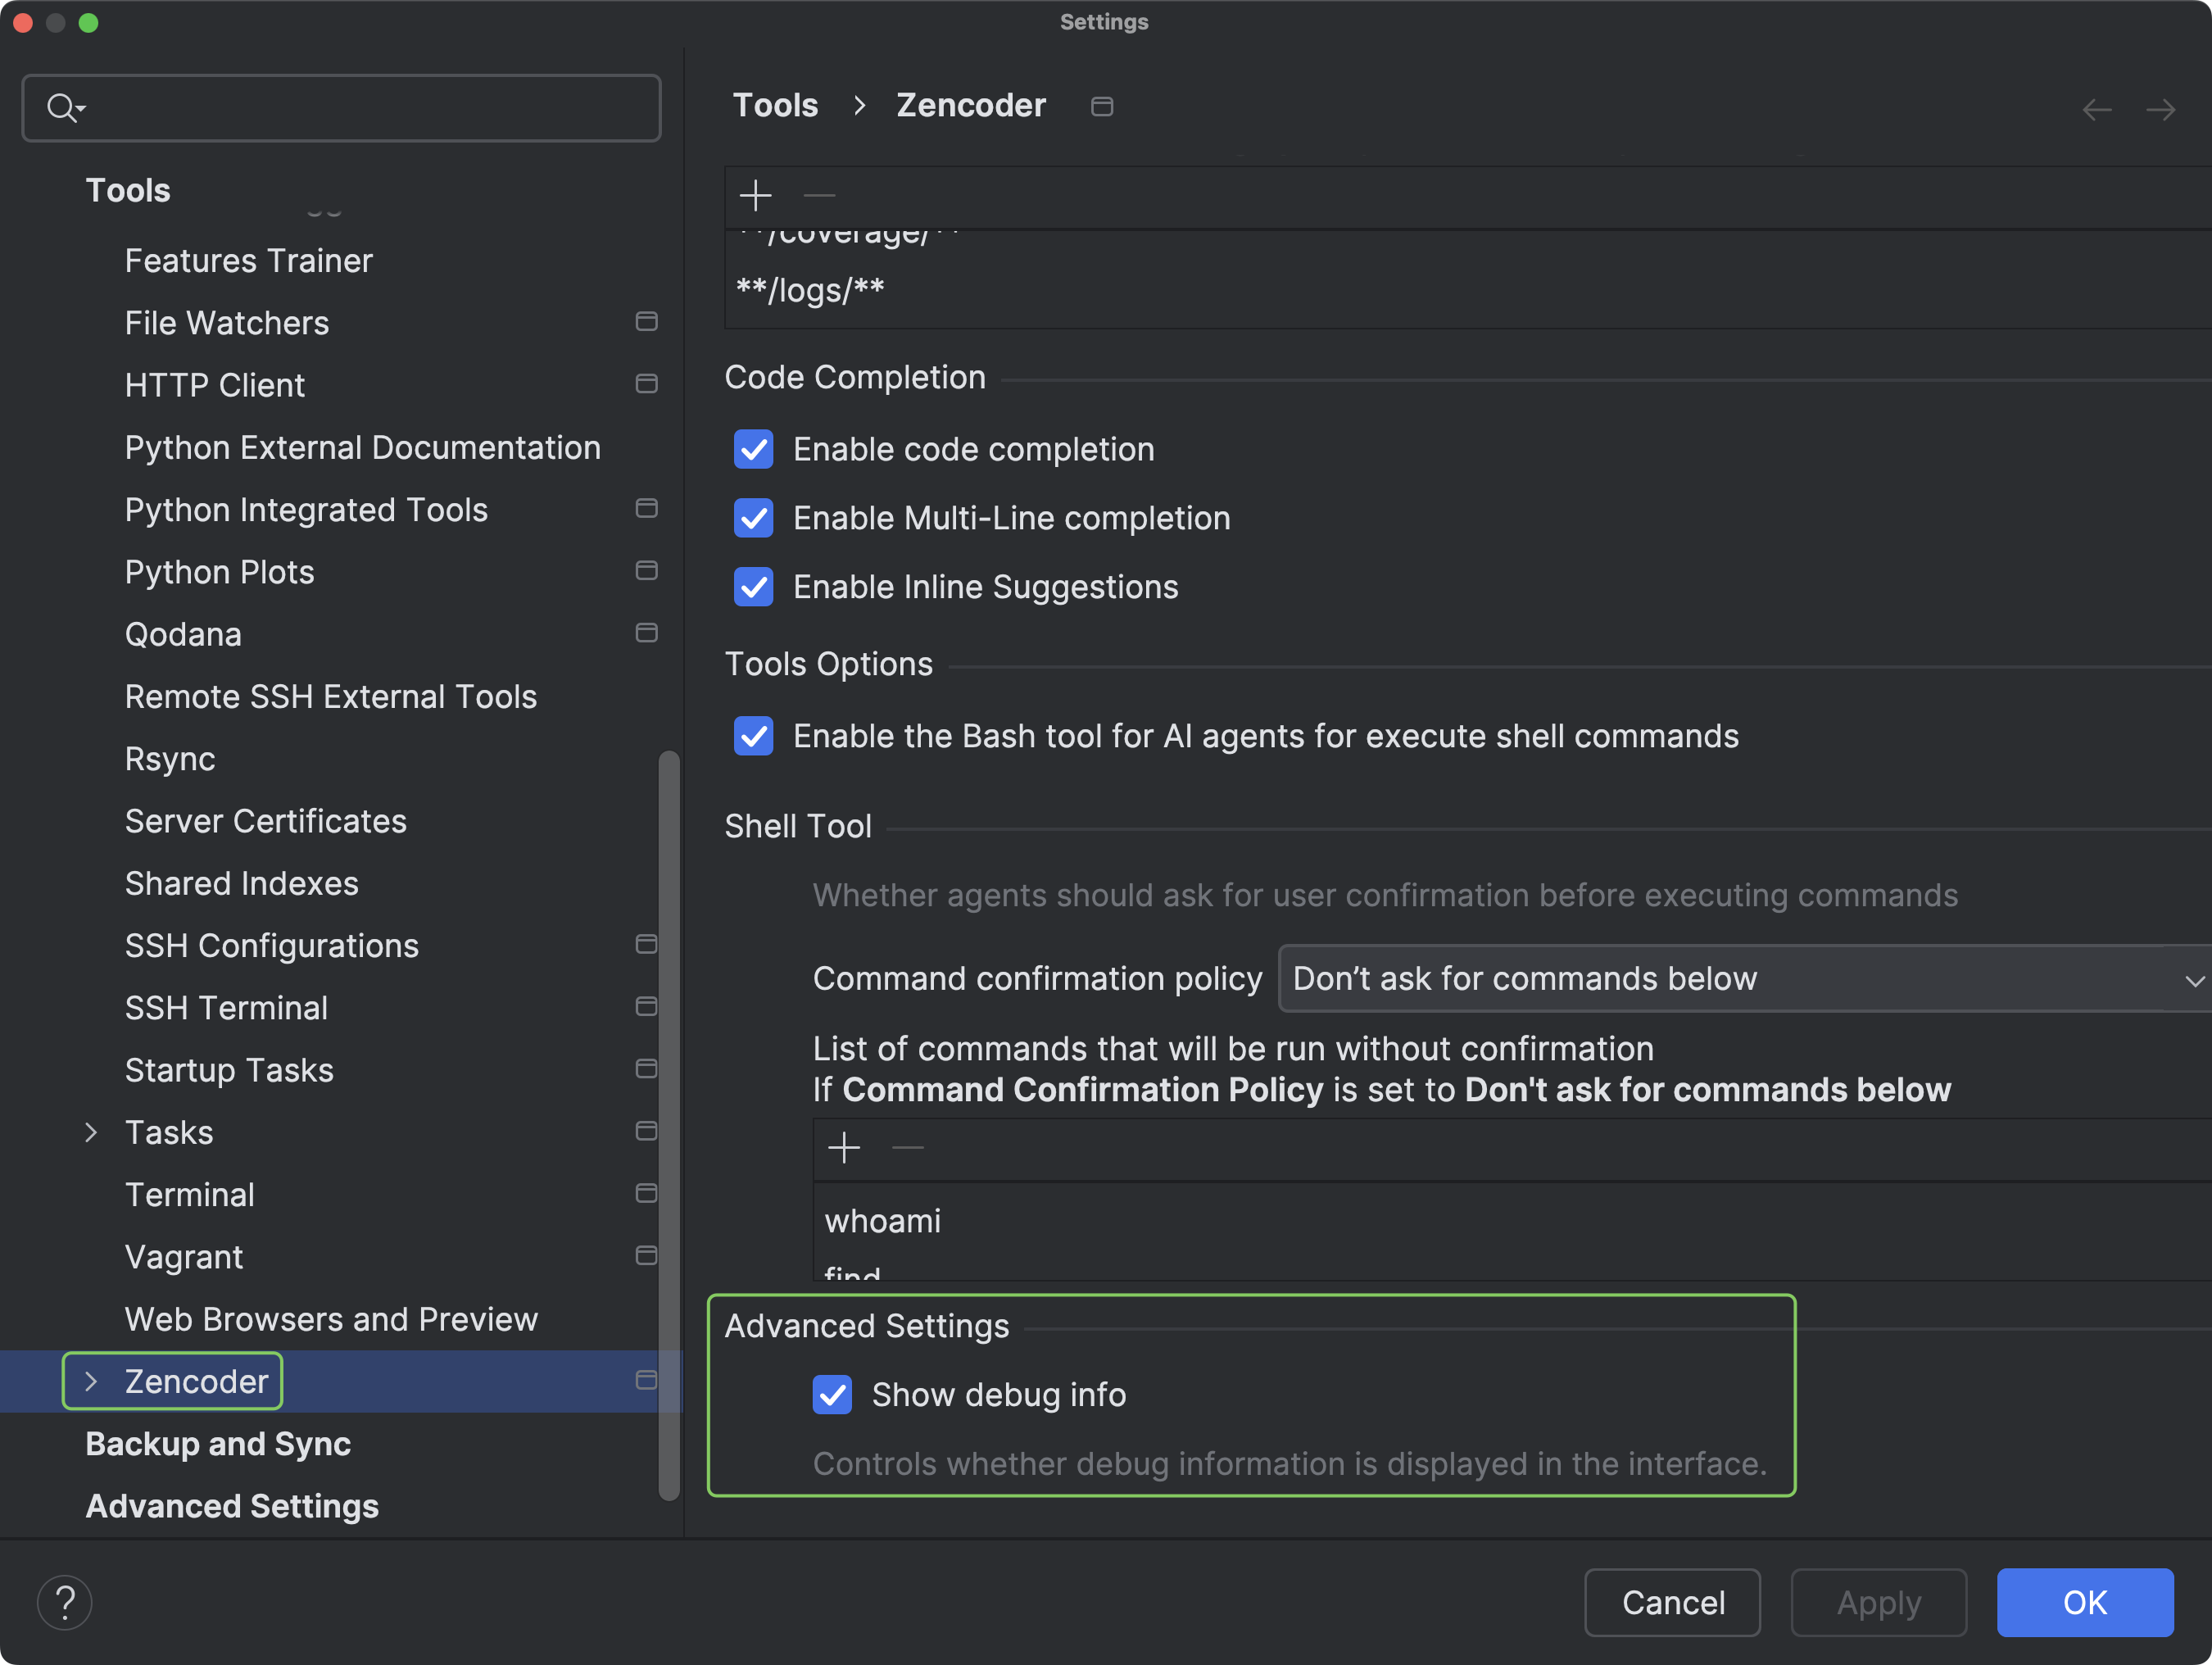
 1. Go to `Settings/Preferences` (`File > Settings` or press `Ctrl+Alt+S` / `Cmd+,`).
2. Navigate to `Tools > Zencoder`.
3. Scroll to `Advanced Settings` and check `Show debug info`.
1. Go to `Settings/Preferences` (`File > Settings` or press `Ctrl+Alt+S` / `Cmd+,`).
2. Navigate to `Tools > Zencoder`.
3. Scroll to `Advanced Settings` and check `Show debug info`.
 Operation IDs will appear in the Zencoder interface:
 Copy and paste the Operation ID along with any error messages (screenshots help) when reporting an issue.
### Accessing Logs
Zencoder logs live in the Output panel:
1. Open the `Output` panel with `Shift+Cmd+U` (macOS) or `Ctrl+Shift+U` (Windows/Linux).
2. In the dropdown at the top-right, select `Zencoder`.
3. Use `Ctrl/Cmd+A` then `Ctrl/Cmd+C` to copy the whole log, or take a screenshot of the relevant lines.
Copy and paste the Operation ID along with any error messages (screenshots help) when reporting an issue.
### Accessing Logs
Zencoder logs live in the Output panel:
1. Open the `Output` panel with `Shift+Cmd+U` (macOS) or `Ctrl+Shift+U` (Windows/Linux).
2. In the dropdown at the top-right, select `Zencoder`.
3. Use `Ctrl/Cmd+A` then `Ctrl/Cmd+C` to copy the whole log, or take a screenshot of the relevant lines.
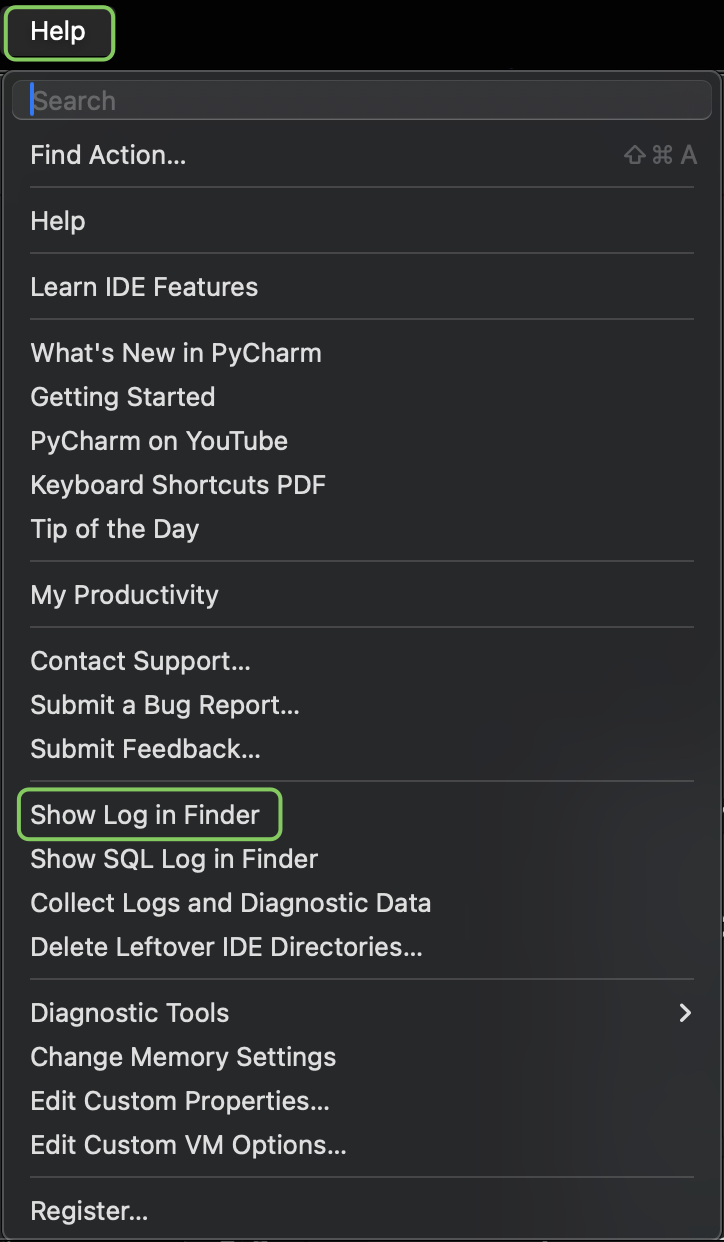
 JetBrains IDEs write logs to a dedicated file:
1. From the main menu, choose `Help`.
2. Click `Show Log in Finder` (macOS) or `Show Log in Explorer` (Windows).
3. Attach the `idea.log` file to your bug report.
JetBrains IDEs write logs to a dedicated file:
1. From the main menu, choose `Help`.
2. Click `Show Log in Finder` (macOS) or `Show Log in Explorer` (Windows).
3. Attach the `idea.log` file to your bug report.
 ### Tips for Useful Logs
1. Reproduce the issue right before capturing the log so the relevant entries are included.
2. Include any error messages shown in the UI.
3. Describe the steps that led to the issue.
4. Mention your OS, IDE version, and Zencoder plugin version.
5. Redact tokens, API keys, and other sensitive data before sharing publicly.
### Screen Recordings
A short recording (using [Loom](https://www.loom.com), macOS `Shift+Cmd+5`, or Windows `Win+G`) is often the fastest way to explain a UI issue.
***
## Known Issues
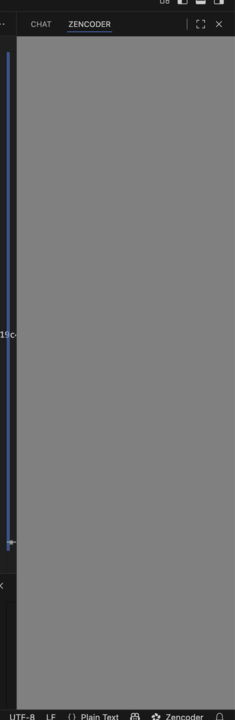
**Symptoms:** The Zencoder chat panel opens as a gray, unresponsive area with no content or error messages. May occur intermittently.
### Tips for Useful Logs
1. Reproduce the issue right before capturing the log so the relevant entries are included.
2. Include any error messages shown in the UI.
3. Describe the steps that led to the issue.
4. Mention your OS, IDE version, and Zencoder plugin version.
5. Redact tokens, API keys, and other sensitive data before sharing publicly.
### Screen Recordings
A short recording (using [Loom](https://www.loom.com), macOS `Shift+Cmd+5`, or Windows `Win+G`) is often the fastest way to explain a UI issue.
***
## Known Issues
**Symptoms:** The Zencoder chat panel opens as a gray, unresponsive area with no content or error messages. May occur intermittently.
 **Status:** We're aware and actively working on a permanent fix.
**Workaround:**
1. Save any open work and quit VS Code completely (not just close the window).
2. Terminate lingering VS Code processes:
* **Windows:** end all VS Code processes in Task Manager.
* **macOS:** quit any VS Code processes in Activity Monitor.
* **Linux:** run `pkill code`.
3. Relaunch VS Code — the Zencoder chat should render correctly.
If the panel is still gray after restart:
* Disable and re-enable the Zencoder extension.
* Run `Developer: Reload Window` from the Command Palette (`Cmd/Ctrl + Shift + P`).
* Check for VS Code and Zencoder extension updates.
**Symptoms:** Installing Claude Code or OpenAI Codex through the [Universal AI Platform](/features/universal-cli-platform) fails with a PowerShell execution policy error such as:
```powershell theme={"system"}
File ...\InstallClaudeCode.ps1 cannot be loaded because running scripts is disabled on this system.
```
**Fix:**
Open PowerShell from your Windows system.
```powershell theme={"system"}
Set-ExecutionPolicy -ExecutionPolicy RemoteSigned -Scope CurrentUser
```
Type `Y` and press Enter to accept the policy change.
Re-run the Claude Code / Codex installation from the Universal AI Platform.
**Symptoms:** Server errors when selecting GPT-5 with a BYOK OpenAI key, or the key connects but GPT-5 refuses to run.
**Why it happens:** This is almost always an OpenAI-side restriction, not a Zencoder issue. GPT-5 access depends on:
1. **Usage tier** — your OpenAI organization must be on a qualifying tier (1–5).
2. **Organization verification** — some orgs must complete OpenAI's verification.
3. **API credits / billing** — insufficient credits will fail requests.
See [OpenAI's model availability doc](https://help.openai.com/en/articles/10362446-api-model-availability-by-usage-tier-and-verification-status) for the current matrix.
**Configure your key correctly:**
1. Click the Zencoder three-dot menu (`⋮`) in your IDE.
2. Select `User API Keys`.
3. Paste your OpenAI API key and toggle it on.
4. Select GPT-5 from the model selector.
**Fix access:**
1. Check your tier in the [OpenAI Developer Console](https://platform.openai.com).
2. Complete [organization verification](https://help.openai.com/en/articles/10910291-api-organization-verification) if prompted.
3. Confirm you have credits or an active billing method.
Zencoder cannot assist with OpenAI verification — the process is entirely managed by OpenAI. While waiting, use an [alternative model](/features/models).
If it still fails after verification: verify the key has no extra spaces, isn't expired or revoked, and try regenerating it in the OpenAI dashboard.
***
## Reporting a New Issue
If your problem isn't listed above, reach out through any of the support channels at the top of this page. Include:
* Your **Operation ID** (see [Debug Information](#debug-information)).
* The **plugin version**, **IDE version**, and **OS**.
* **Steps to reproduce** and **expected vs. actual** behavior.
* **Logs** and, when useful, a **screen recording**.
* The **email address** on your Zencoder account (so we can locate your workspace).
For sensitive data or account issues, prefer email — **[support@zencoder.ai](mailto:support@zencoder.ai)** — over public channels.
For more ways to reach us, see the [Community and Support](/get-started/community-support) page.
**Status:** We're aware and actively working on a permanent fix.
**Workaround:**
1. Save any open work and quit VS Code completely (not just close the window).
2. Terminate lingering VS Code processes:
* **Windows:** end all VS Code processes in Task Manager.
* **macOS:** quit any VS Code processes in Activity Monitor.
* **Linux:** run `pkill code`.
3. Relaunch VS Code — the Zencoder chat should render correctly.
If the panel is still gray after restart:
* Disable and re-enable the Zencoder extension.
* Run `Developer: Reload Window` from the Command Palette (`Cmd/Ctrl + Shift + P`).
* Check for VS Code and Zencoder extension updates.
**Symptoms:** Installing Claude Code or OpenAI Codex through the [Universal AI Platform](/features/universal-cli-platform) fails with a PowerShell execution policy error such as:
```powershell theme={"system"}
File ...\InstallClaudeCode.ps1 cannot be loaded because running scripts is disabled on this system.
```
**Fix:**
Open PowerShell from your Windows system.
```powershell theme={"system"}
Set-ExecutionPolicy -ExecutionPolicy RemoteSigned -Scope CurrentUser
```
Type `Y` and press Enter to accept the policy change.
Re-run the Claude Code / Codex installation from the Universal AI Platform.
**Symptoms:** Server errors when selecting GPT-5 with a BYOK OpenAI key, or the key connects but GPT-5 refuses to run.
**Why it happens:** This is almost always an OpenAI-side restriction, not a Zencoder issue. GPT-5 access depends on:
1. **Usage tier** — your OpenAI organization must be on a qualifying tier (1–5).
2. **Organization verification** — some orgs must complete OpenAI's verification.
3. **API credits / billing** — insufficient credits will fail requests.
See [OpenAI's model availability doc](https://help.openai.com/en/articles/10362446-api-model-availability-by-usage-tier-and-verification-status) for the current matrix.
**Configure your key correctly:**
1. Click the Zencoder three-dot menu (`⋮`) in your IDE.
2. Select `User API Keys`.
3. Paste your OpenAI API key and toggle it on.
4. Select GPT-5 from the model selector.
**Fix access:**
1. Check your tier in the [OpenAI Developer Console](https://platform.openai.com).
2. Complete [organization verification](https://help.openai.com/en/articles/10910291-api-organization-verification) if prompted.
3. Confirm you have credits or an active billing method.
Zencoder cannot assist with OpenAI verification — the process is entirely managed by OpenAI. While waiting, use an [alternative model](/features/models).
If it still fails after verification: verify the key has no extra spaces, isn't expired or revoked, and try regenerating it in the OpenAI dashboard.
***
## Reporting a New Issue
If your problem isn't listed above, reach out through any of the support channels at the top of this page. Include:
* Your **Operation ID** (see [Debug Information](#debug-information)).
* The **plugin version**, **IDE version**, and **OS**.
* **Steps to reproduce** and **expected vs. actual** behavior.
* **Logs** and, when useful, a **screen recording**.
* The **email address** on your Zencoder account (so we can locate your workspace).
For sensitive data or account issues, prefer email — **[support@zencoder.ai](mailto:support@zencoder.ai)** — over public channels.
For more ways to reach us, see the [Community and Support](/get-started/community-support) page.